


Introduction
Education has been reshaped since the advent of information and communication technologies (ICTs) as well as by the rapid incorporation of the Internet into educational processes. Changes have occurred at different educational levels, affecting all involved: students and teachers, even the institutions themselves. The use of virtual learning platforms has grown and is now commonplace in many educational practices (Lavigne, Backhoff-Escudero & Organista-Sandoval, 2008; Backhoff-Escudero, Lavigne, Organista-Sandoval, & Aguirre-Muñoz, 2007; Concannon, Flynn, & Campbell, 2005).
Among current research possibilities, one encounters new objects of study, such as the navigation logs that are automatically generated when using virtual learning platforms. This study seeks to understand how this technology is employed by students. Such research can improve the use of teaching tools, taking into account instructional design, as pointed out in Rochefort and Richmond (2011). Hershkovitz and Nachmias (2008) mention that monitoring student motivation through the analysis of navigation logs allows the instructor to get involved when necessary, with the aim of improving the efficiency of the learning process.
Background
Valuable information about users’ online browsing characteristics and preferences is generated through the daily use of platforms. The information in navigation logs records the behavior of users of the website where the platform is located, regardless of the willingness of these users to provide such information (Martínez, Mateo, & Albert, 2004). However, the analysis of these data involves several challenges, including those of a technical nature, such as sample size, organization and subsequent database management.
This type of analysis is called data mining and, when applied to the field of education, educational data mining (Baker & Yacef, 2009). Online course management systems such as Moodle or Blackboard have their own programs for recording the number of times the system is accessed and the activities that each user undertakes in the virtual space.
According to Hardy, Bates, Antonioletti, and Seed (2005), the analysis of activity logs has been effective for questioning certain aspects of online learning, but in some cases it becomes clear that the implementation of virtual learning environments (VLEs) does not yield the expected results (Buelens, Roosels, Wils, & Van Rentergem, 2002).
Some authors (Feng & Heffernan, 2005, 2007) suggest that the analysis of logs can be useful in building learning support systems or, as noted in Bisson, Bronner, Gordon, Nicaud, and Renaudie (2003), to identify students’ cognitive gaps or difficulties in adapting to the online environment. According to Hoskins and Van Hooff (2005), little is known about the impact of online courses on students’ academic achievement. Dringus and Ellis (2005) attempted to uncover the navigational structure of students that had written texts that were added to forums with the aim of ascertaining their participation. Dönmez, Rosé, Stegmann, Weinberger, and Fischer (2005) performed a multidimensional analysis of collaborative learning by means of linguistic treatment of forum content in order to develop automatic analysis technology. This type of analysis also revealed the operations of collaborative working groups (Perera, Kay, Koprinska, Yacef, & Zaiane, 2009).
At the Autonomous University of Baja California (UABC), Mexico, students have been subjects of research via the navigation logs of several courses on Moodle. Organista-Sandoval, Lavigne, & McAnally-Salas (2008) analyzed students’ online activity and its relation with statistics learning. Students were classified into four clusters, of which two had a great deal of online activity and also showed a tendency toward better grades. Analyses have also been performed on learning styles (Díaz, 2010) and collaborative learning (Vasconcelos, 2011).
The contemporary pedagogy that forms the foundation for e-learning requires that the whole concept of educational material focus on the student. Moreover, the hybrid process of teaching-learning needs new approaches that will lead to more flexible teaching, such as the use of an instructional design based on the characteristics resulting from students’ navigation in VLEs. However, there is a lack of knowledge about the behavior of students in virtual environments. Therefore, this project, which is preliminary in nature, explores to what extent, based on the use of the Moodle platform, learning strategies likely to affect students’ academic performance can be identified.
Method
For this cross-sectional study, which employed a descriptive-exploratory approach, quantitative techniques were used to analyze approximately 15,000 navigation logs from the Moodle1 platform.
Participants
The research was done through an analysis of the navigation logs of 33 students enrolled in a 16 week course titled “Numerical Methods in Computer Engineering” in the School of Engineering, Architecture and Design at the UABC. Based on existing data, we were able to identify the participants’ gender: three women and thirty men. Course instruction was mixed, consisting of both onsite and virtual teaching. The onsite classes were conducted in a computer lab where all the students were connected to the course, performing online tasks under the supervision of the instructor.
Study context
Of the possible options in Moodle that could be used, the instructor included the following virtual activities:
- Forums: These were not mandatory but did account for 10% of the final grade; the forums had an evaluative function, offering students the opportunity to present evidence of their performance in order to provide feedback and assess learning.
- All of the suggested readings for the course were on the platform or on some other virtual site; not all the readings were mandatory and students were not penalized if they failed to do them.
- Questionnaires and assignments, which were all mandatory and delivered virtually via the platform, had deadlines, and students were penalized if they were turned in late.
- Feedback for each assignment was given through the platform; the final grade was given by the instructor.
Data collection
For the data collection, the navigation logs, which were available as reports, were extracted from the Moodle platform by accessing the server logs, selecting the course and, within the course, all the students and their respective activities. The data were exported to Excel and a database was generated. The students’ final grades – for the activities carried out on the platform only – were also extracted.
Variables
The extracted data (retrieved directly from Moodle) were subsequently transformed into generic variables, from which derived variables were inferred. As the platform offers seven types of resources and 22 types of activities, plus tailored modules, the resources were stored in a single category, Resources, and the activities were reorganized into three categories: Assignments, Users, Forums – plus the Homepage.
The variables used are as follows:
- Connection date. Obtained by identifying the date (month and day) when the student logged into the platform.
- Connection time. Obtained by identifying the exact time (hour, minutes and seconds) when the student requested log-in. At the analysis level it was divided into five periods: 1:00 am to 5:59:59 am; 6:00 am to 10:59:59 am; 11:00 am to 3:59:59 pm; 4:00 pm to 8:59:59 pm; and 9:00 pm to 12:59:59 am.
- Actions performed on the platform. Obtained by identifying the module the student accessed: homepage, forums, resources, activities and user.
- IP address. Obtained by identifying the IP address from which the student logged into the platform; these were divided into two categories: those belonging to the UABC and those that did not.
- Final grade. Obtained by identifying the grade that the instructor gave each student for the activities undertaken on the platform.
- Total number of HITS.2 Obtained by counting the total number of times the student requested access to any page and/or module within it.
- Total number of log-ins. Obtained by identifying the number of times the student logged into Moodle.
- Mean length of each HITS. Obtained by dividing total length of time by the total number of HITS.
- Mean session length. Obtained by dividing total amount of time logged in by the total number of sessions.
- Total HITS per student in each of the modules or activities. Obtained by identifying the user’s name within the activity modules and counting the number of HITS.
- Log-in interval. Obtained by identifying the time when the student logged into the platform as well as the time when he or she logged out.
Analysis tools
For the descriptive and inferential analyses, we used the Statistical Package for Social Sciences (SPSS). Cluster analysis, as in Pérez & Santín (2006), consisted in dividing the group of students one or more times based on specific characteristics; the agglomerative clustering method was used.
With the Organization Risk Analyzer (ORA)3 for dynamic meta-network assessment, paths were identified using the database developed in Excel specifically for use in ORA. As the use of this tool for this type of research is uncommon, a sample was taken and the paths of ten students were analyzed and plotted, although in this article just one case is presented as an example.
Procedure
First, the navigation logs for each student were retrieved and exported to Excel; the data were filtered by removing irrelevant information. Statistical analysis was performed using SPSS software. Subsequently, the navigation paths were developed using the ORA application.
It is worth remembering that Moodle does not identify the log-ins themselves. It was necessary to identify them based on the date, mean length of log-in, URL and the type of web page accessed before and after what appears to be a new log-in, and sort them into chronological order. Likewise, the time format needed to be adjusted so that it was possible to display seconds.
Results
Navigation characteristics
The descriptive elements of the main variables are revealed through the navigation characteristics. The time format is expressed in days (dd), hours (hh), minutes (mm) and seconds (ss). The use of all or some of these time elements is case dependent.
As can be seen below, the total number of log-ins throughout the course was 997, with a standard deviation of 27.63; the total number of HITS was 15,779, with a mean of 478.15 and a standard deviation of 176.83, which underscores the vast differences between students. The mean time per HITS was 1 minute and 34 seconds; the minimum was 41 seconds and the maximum, 2 minutes and 32 seconds.
Table 1. Description of the main variables
|
Variables |
Total |
µ |
σ |
Minimum |
Maximum |
|---|---|---|---|---|---|
|
Log-ins |
997 |
30.21 |
27.63 |
12 |
151 |
|
HITS |
15,779 |
478.15 |
176.83 |
284 |
1,187 |
|
Session length |
16:20:35:23 |
12:15:37 |
4:34:42 |
3:48:42 |
21:11:55 |
|
Mean HITS (mm:ss) |
51:50 |
01:34 |
00:27 |
00:41 |
02:32 |
As a group, the students invested a total of 16 days, 20 hours, 35 minutes and 23 seconds on the platform, a mean of 12 hours, 15 minutes and 37 seconds per student. Table 2 shows the modules in which all the available activities were grouped. Assignments had a total of 7,314 HITS, while the four remaining modules together received a total of 8,458 HITS. It should be noted that Homepage indicates the course access page as well as the page to which one returns from loop trajectories, such as when the back-space key is pressed.
Table 2. Description by activity module
|
Modules |
Total HITS |
µ |
σ |
Minimum |
Maximum |
|---|---|---|---|---|---|
|
Assignments |
7,314 |
221.64 |
60.02 |
138 |
447 |
|
Resources |
2,485 |
75.30 |
31.57 |
21 |
188 |
|
Forums |
2,516 |
76.24 |
37.82 |
20 |
210 |
|
Homepage |
2,870 |
86.97 |
56.61 |
37 |
285 |
|
User |
587 |
17.79 |
23.11 |
1 |
136 |
Table 3 shows the description of the time frames in which the students were logged into the course. The night-time and early morning periods from 9:00 pm to 12:59 am and 1:00 to 5:59 am represent 42.89% of the total log-ins; those that occurred between 4:00 and 8:59 pm, comprising 49.95% of the log-ins, correspond to sessions at the onsite laboratory.
Table 3. Description by time of log-in
|
Schedule |
Total Log-ins |
% |
µ |
σ |
Minimum |
Maximum |
|---|---|---|---|---|---|---|
|
1:00 - 5:59 am |
260 |
24.78 |
7.88 |
11.621 |
0 |
54 |
|
6:00 - 10:59 am |
44 |
4.19 |
1.33 |
1.88 |
0 |
8 |
|
11:00 am - 3:59 pm |
28 |
2.66 |
0.85 |
1.34 |
0 |
5 |
|
4:00 -8:59 pm |
524 |
49.95 |
15.88 |
8.46 |
9 |
47 |
|
9:00 pm- 12:59 am |
190 |
18.11 |
5.76 |
9.41 |
0 |
51 |
The following table shows descriptions grouped by month and HITS, as well as the mean time per HITS and log-in. Two peaks of activity can be observed, in September and November, but the length of time per HITS decreased steadily.
Table 4. Description grouped by month
|
Month |
HITS |
Length hh:mm:ss |
Length dd:hh:mm |
|||
|---|---|---|---|---|---|---|
|
Total |
µ |
σ |
Mean per HITS |
Mean per log-in |
Total of log-ins |
|
|
August |
3,135 |
95 |
4.7 |
00:02:17 |
03:28:03 |
04:18:25 |
|
September |
4,665 |
141.3 |
63.0 |
00:01:39 |
04:11:30 |
05:18:19 |
|
October |
3,538 |
107.2 |
66.6 |
00:01:21 |
02:27:17 |
03:09:00 |
|
November |
4,215 |
127.7 |
64.2 |
00:00:53 |
02:03:37 |
02:19:59 |
Table 4 above shows the distribution of the mean length per HITS by month. A steady drop in the mean time per HITS can be observed, which indicates faster navigation and better use of time. Likewise, the total duration of sessions per month rose during the second month and decreased steadily thereafter.
Cluster Analysis
Given the size of the standard deviations of some variables, the idea arose that there might be groups within the student group as a whole. A non-hierarchical k-means cluster analysis (Pérez & Santín, 2006) was performed on the data collected.
Table 5 shows the ANOVA analysis results, where the F values for the main variables can be seen, as well as the significance level, which was less than 0.05 for the four variables.
Table 5. ANOVA result
|
|
Cluster |
Error |
F |
Sig. |
||
|---|---|---|---|---|---|---|
|
Main variables |
Mean square |
df |
Mean square |
df |
||
|
Total HITS |
169,625.7 |
1 |
26806.4 |
31 |
6.328 |
0.017 |
|
Total log-ins |
3,440.313 |
1 |
677.2 |
31 |
5.080 |
0.031 |
|
Length of log-in (in seconds) |
6.115E9 |
1 |
8.320E7 |
31 |
73.496 |
0.000 |
|
Mean length of HITS (in seconds) |
12,294.789 |
1 |
391.7 |
31 |
31.382 |
0.000 |
The characteristics of the two groups are shown in Table 6. The total number of HITS for Group 2 was 2,843 lower than for Group 1. The total number of log-ins for Group 1 was 682, double that of Group 2, which logged in 315 times. The mean final grade, for the activities on the virtual course only, was 99.6 % for Group 1 and 98% for Group 2, that is, almost the same for both groups.
Table 6. Characteristics by group
|
Descriptive characteristics by group |
Group 1 |
Group 2 |
|---|---|---|
|
Total students |
17 |
16 |
|
Total HITS |
9,311 |
6,468 |
|
Mean length of HITS (mm:ss) |
01:53 |
01:15 |
|
Total log-ins |
682 |
315 |
|
Mean number of log-ins |
40 |
20 |
|
Mean length of session (mm:ss) |
32:49 |
27:04 |
|
Mean length of session per course (hh:mm:ss) |
15:55:43 |
08:21:45 |
|
Mean grade |
99.6 |
98 |
Table 7 shows that the assumption of equality of variances was supported by Levene’s test, since a value of 0.000 was obtained; therefore, the observed values for Student’s t-test of 2.929 are taken into account, with a significance level of 0.006.
Table 7. Contrast t-student for independent samples
|
Final Grade |
Levene’s test for equality of variances |
Student’s t-test for equal means |
|||||
|---|---|---|---|---|---|---|---|
|
F |
Sig. |
t |
df |
Bilateral sig. |
Mean Diff. |
Dif. standard error |
|
|
Equality of variances assumed |
16.176 |
.000 |
2.929 |
31 |
0.006 |
1.51651 |
0.51776 |
|
Equality of variances not assumed |
- |
- |
2.854 |
17.606 |
0.011 |
1.51651 |
0.53140 |
These results indisputably point to the existence of two groups.
Navigation paths
Navigation paths that shed light on the way the student negotiates the platform while making use of the different options available can be inferred by identifying what he or she accesses during each session. To date, we have been unable to find any software specifically for analyzing the students’ navigation paths, making it necessary to do the analysis by hand; therefore, we present the results for just two students, one from each group.
In the condensed report of the two students’ sessions, important differences in navigation stood out immediately. Student 1 logged in 34 times and participated considerably more in the forums and consulted the available learning resources more times than Student 2, who only logged in 12 times and focused on completing the assignments, both at the beginning and the end of the course. The first received a grade of 100% and the second 94.7%.
The following figure shows the navigation paths followed by the students throughout the course. Student 1 showed greater activity; of the 308 HITS recorded for this student participating in the course, 205 took place in the assignments module, compared with 232 for Student 2, which means that Student 2 dedicated 65.5% of his or her online time to performing learning activities, while Student 1 dedicated 44.8%.
Figure 1. Navigation paths of the two students analyzed, produced as they accessed different modules of the platform during the course, divided into months
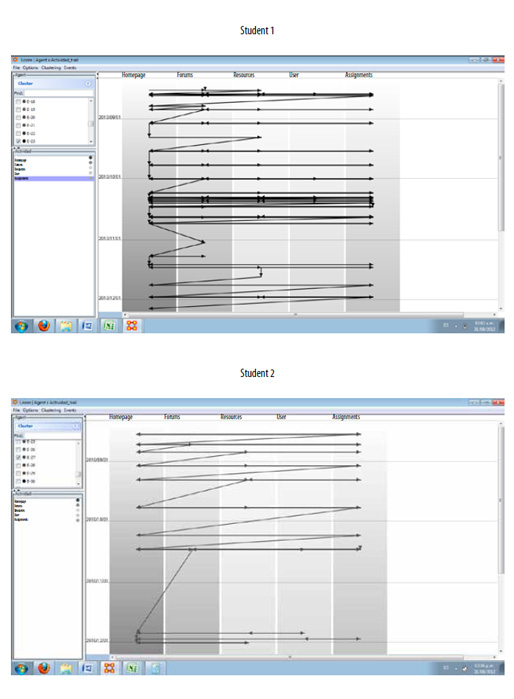
Students in Group 1, characterized by greater activity on the platform (in terms of the number of accesses and time spent), obtained a higher mean grade (99.6%). Students in Group 2, characterized by less activity on the platform, obtained a lower mean grade of 98%. Thus, each group had a learning strategy that was almost the complete opposite of the other’s. For Group 1, it was achieving the maximum grade, regardless of the time spent online, while for Group 2, it was spending less time online to achieve an optimum grade. It should be noted that the difference between the two mean grades, despite being small, was statistically significant.
Discussion
In this study, key elements of the teaching-learning process, whether virtual or not, became evident through the students’ accessing the various elements within the different modules, such as assignments and resources, which included questionnaires and lectures (Coll, 2004). Around 9,700 of the 15,779 total HITS made throughout the entire course by the students were presented. The importance of the processes of socialization (Ávila & Bosco, 2001) and communication (Barajas, 2002) have been recognized, evidenced in this case by the 2,500 occasions on which the students accessed the forum module. As in Boneu (2007), the students had the option of using the platform at any time of the day or night from any location.
The students’ success in finding different ways of navigating within the VLE demonstrated the potential to which Díaz (2010) refers. While the virtual platform offers the same range of possibilities to all users, each inherently determines the results of its use, regardless of the platform structure or the design intent that the instructor implements. By utilizing the information at the time it is generated to provide the instructor with feedback, navigation logs may have a positive impact on teaching practice by guiding instructors in their performance and helping them choose the content and strategy to employ in order to obtain the best academic outcomes.
Do students follow the learning paths established by instructors? Yes; the logs analyzed suggest that they make use of the resources more independently. Do students apply something similar to free will in managing their navigation paths in VLEs? Most definitely; students decide how to access the platform and how to navigate within it, within its design limits.
From this preliminary analysis, some observations were made that could be transformed into knowledge through further studies of this type. According to Lavigne, Organista and McAnally (2008), and Lavigne, McAnally-Salas, Organista-Sandoval, Díaz-López, and Vasconcelos-Ovando (2011), it appears to be usual for the duration of HITS to decrease over time, with a mean length of approximately one minute. This observation raises certain questions: What can students do in one minute? How can instructors design activities under these circumstances?
Based on their navigational characteristics, it was possible to identify two groups of students, each with very different learning strategies in terms of the use of the navigational possibilities offered, but with relatively similar success. It should be emphasized that these two groups had very different navigation patterns, which were the result of the different learning strategies chosen and, consequently, each one’s use of time in the virtual space. Nevertheless, the final grades were equally high in both groups. This element, which was also observed by Lavigne et al. (2008), should be the object of further study in order to define lines of flexibility in instructional design. As this is an emerging topic, the tools and techniques available for the treatment of data are currently not the most expedient. Comparative studies using samples comprising students with different profiles and technological abilities could be conducted. Furthermore, qualitative analysis could clarify behaviors thus far unexplored and, therefore, unknown.

